Useful Splunk Queries and Windows Event Log
In the world of managing and analyzing data, nothing beats efficiency and precision. Splunk, a leader in log analysis, relies on the Search Processing Language (SPL), a versatile tool that excels in querying, analyzing, and deriving insights from colossal datasets.
Understanding SPL: The Language of Splunk
At its essence, SPL is a domain-specific language designed specifically for Splunk’s search and data manipulation capabilities. It serves as the bridge between raw data and actionable insights, allowing users to unleash the full potential of their data through a series of commands, functions, and operators.
The Power of SPL
Querying and Filtering
SPL equips users with a rich set of commands to search and filter data. From simple keyword searches to complex queries using Boolean logic and regular expressions, SPL empowers users to pinpoint and extract the precise information they seek from immense datasets.
Transforming and Analyzing Data
Beyond mere querying, SPL facilitates data transformation and analysis. Its extensive library of functions enables users to manipulate data, perform statistical analysis, calculate metrics, and generate visualizations, thereby unlocking deeper insights from raw information.
Customization and Flexibility
One of SPL’s greatest strengths is its flexibility and extensibility. Users can create custom commands and macros, tailoring their queries and analyses to specific use cases and business needs. This adaptability makes SPL a versatile tool capable of addressing a wide array of data challenges.
SPL in Action
Consider a cybersecurity analyst tasked with identifying potential security breaches within a network. Through SPL, the analyst crafts a series of queries to search through log data, extract relevant information about access attempts, and detect anomalous patterns in real-time. This allows for swift identification and mitigation of potential threats, bolstering the network’s security posture.
In the next few sections, we would be looking at some useful queries against Windows Security Log events.
User Account Creation
We will start by running a query to identify the accounts created within the last 24 hours using the Event ID 4720 and we will build a table with the desired field for our output.
source="WinEventLog:Security" EventCode=4720
| table _time host Account_Name SAM_Account_Name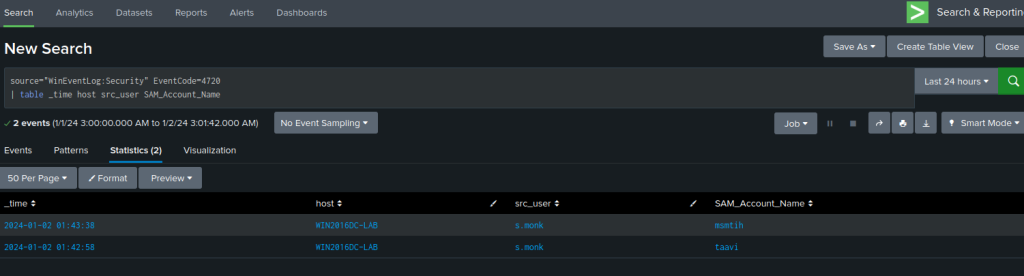
Based on the result, we can see that the user s.monk created two accounts msmith and taavi at the specified time.
Password Reset (change)
Leveraging the Event ID 4724, we can create a query to uncover accounts that have undergone recent password changes.
EventCode=4724 user!="*$"
| stats count values(user) AS TargetUser latest(_time) AS LatestTime by src_user
| rename src_user AS SrcUser
| sort -count
| convert timeformat="%Y-%m-%d %H:%M:%S" ctime(LatestTime)
| table LatestTime SrcUser TargetUser count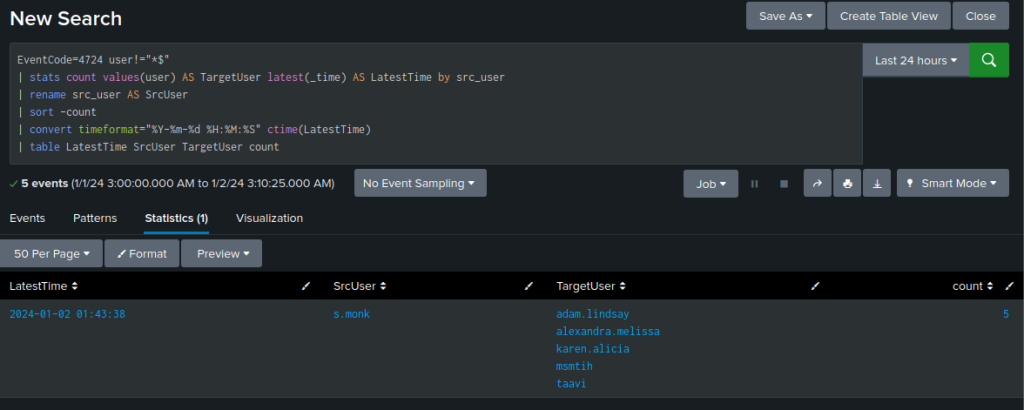
The user s.monk had 5 actions, and changed the password for the account listed in the TargetUser column.
Over 80% authentication failure
One way to discover brute force attempts is to look at the authentication failure rate percentage for accounts within a specified time period.
The query below calculate the failure rate percentage for failure count above 50 and display anything above 80% within the last 24 hours.
source="wineventlog*"
| stats count by status, user
| chart last(count) over user by status
| fillnull  value=0
| where failure >= 50
| eval failure_rate = 100*failure/(failure + success)
| where failure_rate >= 80 and failure_rate <= 100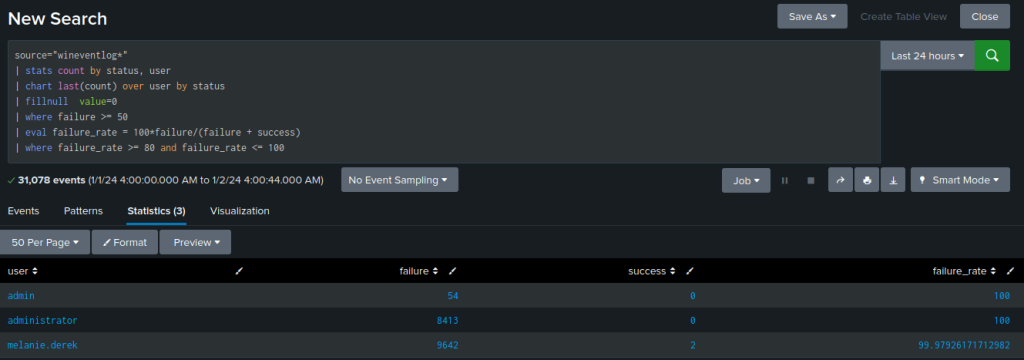
Failed logon and associated method
In this last example, we will search for account failure associated with the Event ID 4625. This event proves invaluable as it captures every unsuccessful attempt to log in to the local computer, irrespective of the logon method, user location, or account type involved.
The query will also turn the logon type into a human readable format when you get the result.
sourcetype="wineventlog*" EventCode=4625 | fillnull value=NULL | eval Account_Name = mvindex(Account_Name,1)
| eval Security_ID = mvindex(Security_ID,1)
| eval LoginType=case(Logon_Type=3,"RPC (not RDP)",Logon_Type=4,"Batch",Logon_Type=5,"Service",Logon_Type=7,"Screen Unlock/Session Resume",Logon_Type=10,"Remote Desktop",Logon_Type=11,"Cached",Logon_Type=9,"New Credentials")
| stats count(Security_ID) as "Login Events" by Security_ID, Account_Name, LoginType,host,_time  | sort -"Login Events"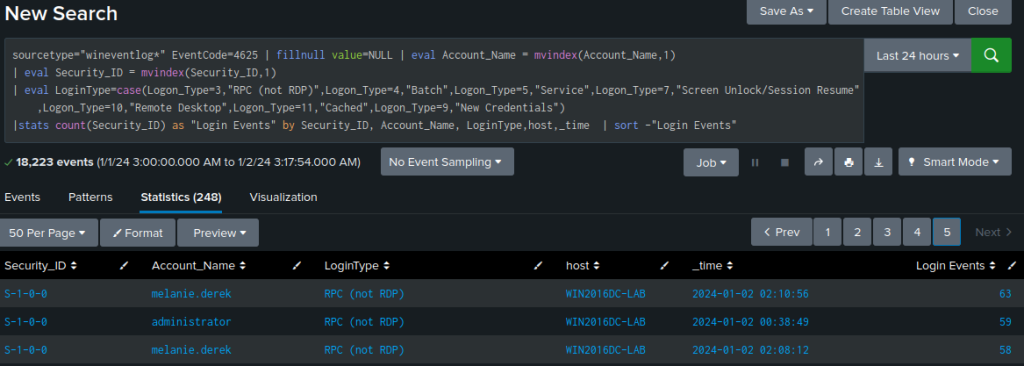
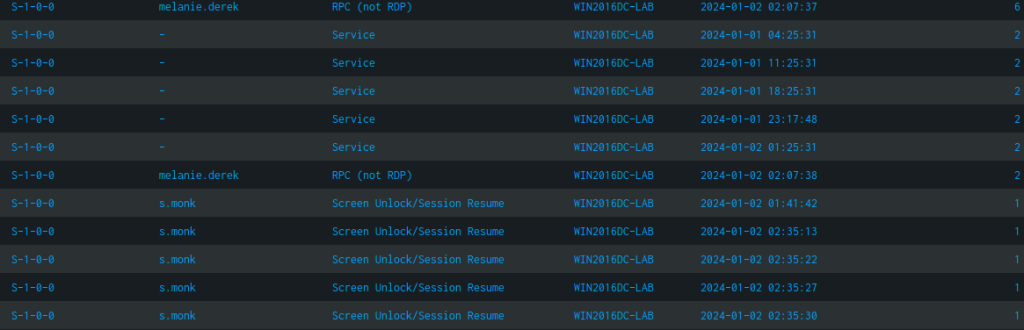
We receive a summary table detailing the number of unsuccessful login attempts for each account, along with the method that led to the failure.
For instance, there are several occurrences logged for the user s.monk, where incorrect credentials were entered in an effort to unlock the workstation from the locked screen or screensaver.
Conclusion
SPL, within the Splunk ecosystem, is more than just a language—it’s a gateway to unlocking the latent potential within data. Its capabilities in querying, transforming, and analyzing data empower users to derive meaningful insights, driving informed decision-making, enhancing operational efficiency, and fortifying security measures.
Splunk’s Search Processing Language, with its prowess and versatility, remains an indispensable asset in the arsenal of data analysts and organizations seeking to derive value from their data assets.
If you have any questions or require assistance, we are actively seeking strategic partnerships and would welcome the opportunity to collaborate. Don’t hesitate to contact us!