Leveraging Splunk for Palo Alto Firewall Logs – Part 2
In the first part, Leveraging Splunk for Palo Alto Firewall Logs , we address the essential steps and configuration for setting up Palo Alto firewalls to send logs to your local Splunk instance. In this second part, we’ll review several methods to verify that everything is configured correctly and to confirm the successful transmission of events from the firewall to the Splunk server.
To ensure everything is functioning correctly, the simplest method is to set up the firewall to log all configuration events to syslog.
On your firewall, Navigate to Device > Log Settings > Config and save your changes. Afterward, make any configuration changes, and the firewall will generate a syslog entry for the configuration event, even if the change hasn’t been committed.
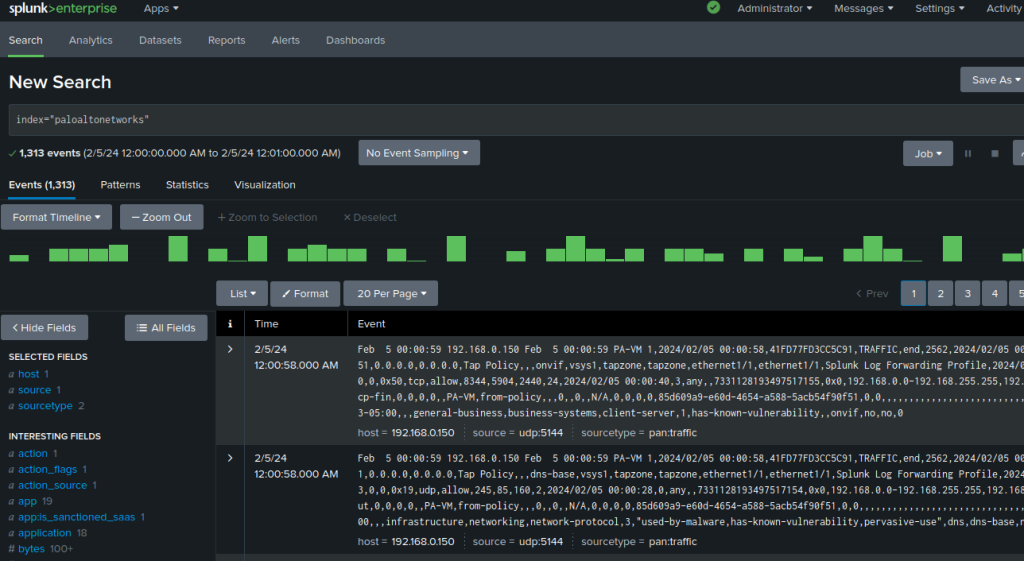
You can confirm the log has been sent to Splunk by accessing the Search and Reporting, and entering the relevant search query. We will be using the name of the index we defined when we created the input.
index=”paloaltonetworks”
Addon Health Check
We can also use the add-on health check to validate our installation is working correctly.
- Navigate to Apps
- Palo Alto Network Add-on
- Select the Health tab
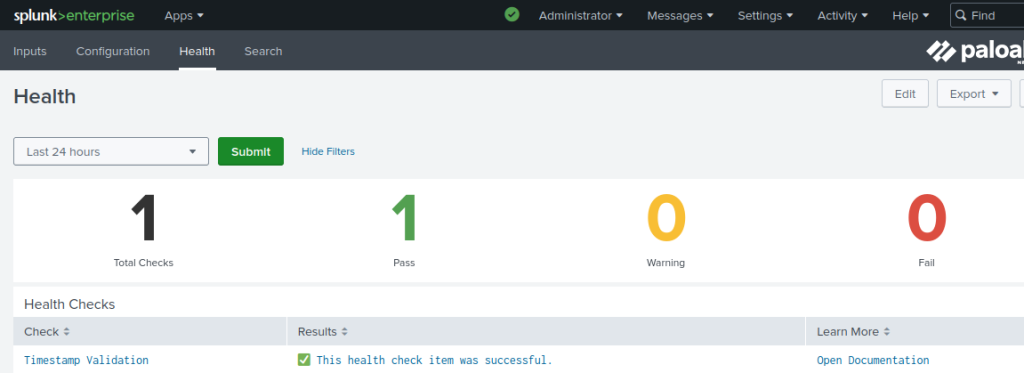
The Timestamp Validation health check verifies whether the logs in the Splunk app are in the correct time zone.
A frequent issue we’ve come across with some of our customers is the failure to configure an NTP source for both the Splunk server and the Palo Alto firewall. If logs carry timestamps that are ahead or behind, the timestamp validation health check will fail, hampering accurate data correlation.
Data Model Acceleration
We also need to make sure that the data model acceleration was enabled and currently working correctly.
- Navigate to Apps
- Palo Alto Networks
- Select the Operations tab -> Data Model Audit
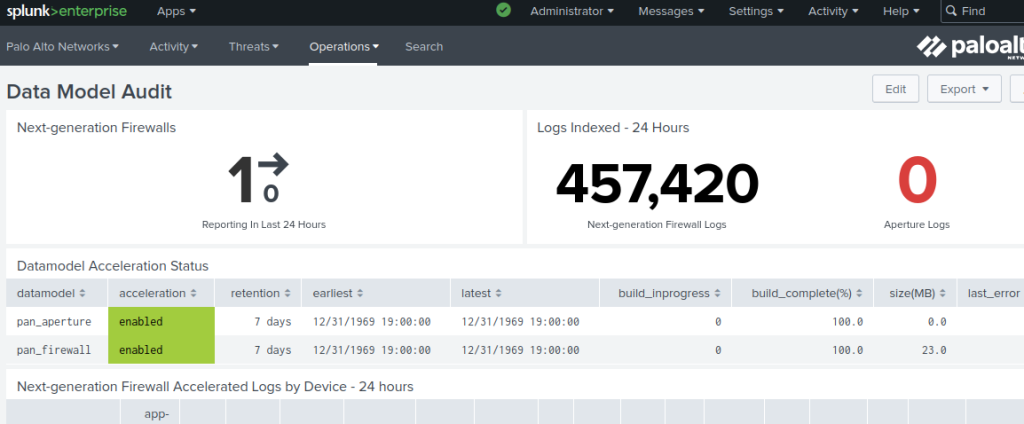
You can clearly see the status of the datamodel acceleration in this page, confirming that you have configured it correctly. You can also see the number of logs event that have been indexed.
Firewall system
An overview of the current Firewall system event can be accessed by
- Navigatiing to Apps
- Palo Alto Networks
- Select the Operations tab -> Firewall System
- Adjust the time range as needed

If no logs show up, then the logs are not getting indexed correctly. Use these steps to find the problem:
- Make sure you read again part 1 and double check your steps
- Perform a search for index=’paltoaltonetwork’ with ‘All time’ as the timeframe.
- Check that the clocks and timezones on the firewall and Splunk server are the same
- Make sure the syslog server configuration (port) matches on both firewall and splunk
- if using a TCP or SSL port for syslogs, try UDP instead, then switch to TCP or SSL once UDP is working
If you have any questions or require assistance, don’t hesitate to contact us!