Analyzing AWS VPC Flow Logs with Elasticsearch, AWS SQS, and Filebeat
AWS VPC Flow Logs are a goldmine of network data, providing valuable insights into traffic patterns, security threats, and network performance within your Amazon Virtual Private Cloud (VPC). To effectively analyze this data, many choose to utilize Elasticsearch, an open-source search and analytics engine. In this blog post, we’ll walk you through the process of setting up Elasticsearch with the help of AWS Simple Queue Service (SQS) and Filebeat to ingest and analyze AWS VPC Flow Logs. This approach offers flexibility, scalability, and real-time data ingestion.
Before we dive into the steps, let’s address some crucial questions:
- What are AWS VPC Flow Logs?
- AWS VPC Flow Logs capture detailed information about network traffic in your VPC, such as source and destination IP addresses, ports, and more.
- Why use Elasticsearch with VPC Flow Logs?
- Elasticsearch is a robust tool for efficiently indexing, searching, and analyzing vast amounts of log data, making it an ideal choice for VPC Flow Logs analysis.
- What is AWS SQS, and why use it in this setup?
- AWS SQS is a fully managed message queue service. We use it as an intermediary to decouple the flow log data from the ingestion process, enabling better scalability and fault tolerance.
- Why Filebeat?
- Filebeat is a lightweight log shipper that simplifies the process of sending log data to Elasticsearch. It ensures efficient, real-time data ingestion.
Architecture
The architecture below in Figure 1 show the process of ingesting AWS VPC flows logs into a local instance of Elasticsearch
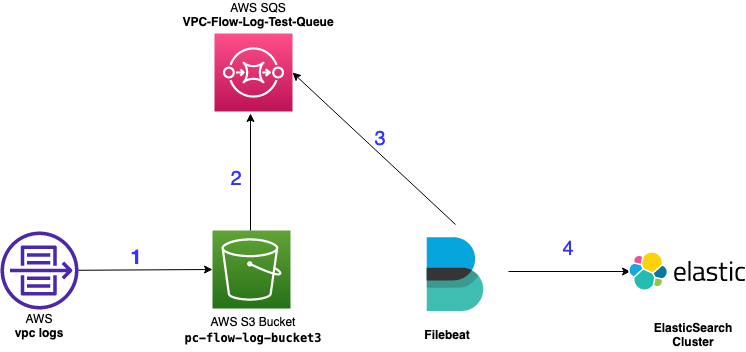
- VPC logs are sent to a S3 Bucket
- The S3 bucket sends an “object create” event notification to an Amazon Simple Queue Service (SQS) queue for every object stored in the bucket.
- Filebeat queries and pull messages from AWS SQS
- Filebeat send the data into the ElasticSearch cluster.
Step 1: Setting Up Elasticsearch Locally
Before we get started with AWS services, you’ll need Elasticsearch up and running on your local machine. Follow these general steps:
- Download and install Elasticsearch: Visit the official Elasticsearch website (https://www.elastic.co/guide/en/elasticsearch/reference/current/install-elasticsearch.html) and download the appropriate version for your platform.
- Configure Elasticsearch: Customize Elasticsearch settings according to your hardware resources and any specific cluster configurations you require.
- Start Elasticsearch: Run Elasticsearch locally using the appropriate command.
- Verify Elasticsearch: Open your web browser and go to your local instance (for example https://192.168.0.160:9200/) to ensure that Elasticsearch is up and running.
Step 2: Setting Up AWS SQS for VPC Flow Logs
Now, let’s configure AWS SQS to serve as the intermediary between VPC Flow Logs and Elasticsearch:
- Enable VPC Flow Logs: If you haven’t already, enable VPC Flow Logs for the relevant VPC(s) in your AWS account. Make sure they are being stored in an S3 bucket. The S3 bucket used in this exercise will be “vpc-flow-log-bucket3“.
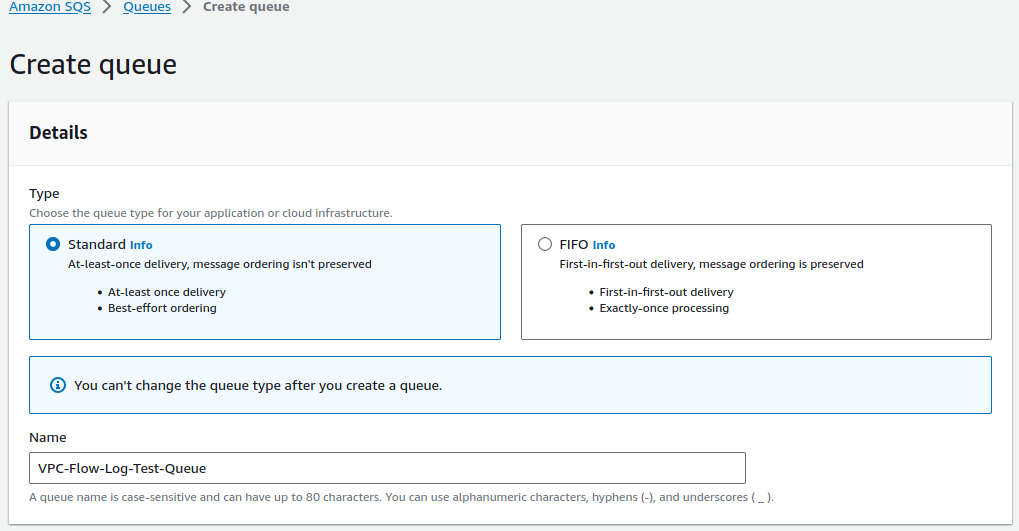
- Create an SQS queue: In your AWS Management Console, navigate to SQS, and create a new queue. This queue will act as a buffer for incoming log data.
We will be using the queue name “VPC-Flow-Log-Test-Queue” for this exercise. - In the Access policy section, select Advanced, and update your policy to match the below example. Make sure to update the name of the S3 Bucket, source account and queue name accordingly.
{
  "Version": "2012-10-17",
  "Id": "__default_policy_ID",
  "Statement": [
    {
      "Sid": "__owner_statement",
      "Effect": "Allow",
      "Principal": {
        "Service": "s3.amazonaws.com"
      },
      "Action": "SQS:SendMessage",
      "Resource": "arn:aws:sqs:us-east-1:0123456789:VPC-Flow-Log-Test-Queue",
      "Condition": {
        "StringEquals": {
          "aws:SourceAccount": "0123456789"
        },
        "ArnLike": {
          "aws:SourceArn": "arn:aws:s3:*:*:vpc-flow-log-bucket3"
        }
      }
    }
  ]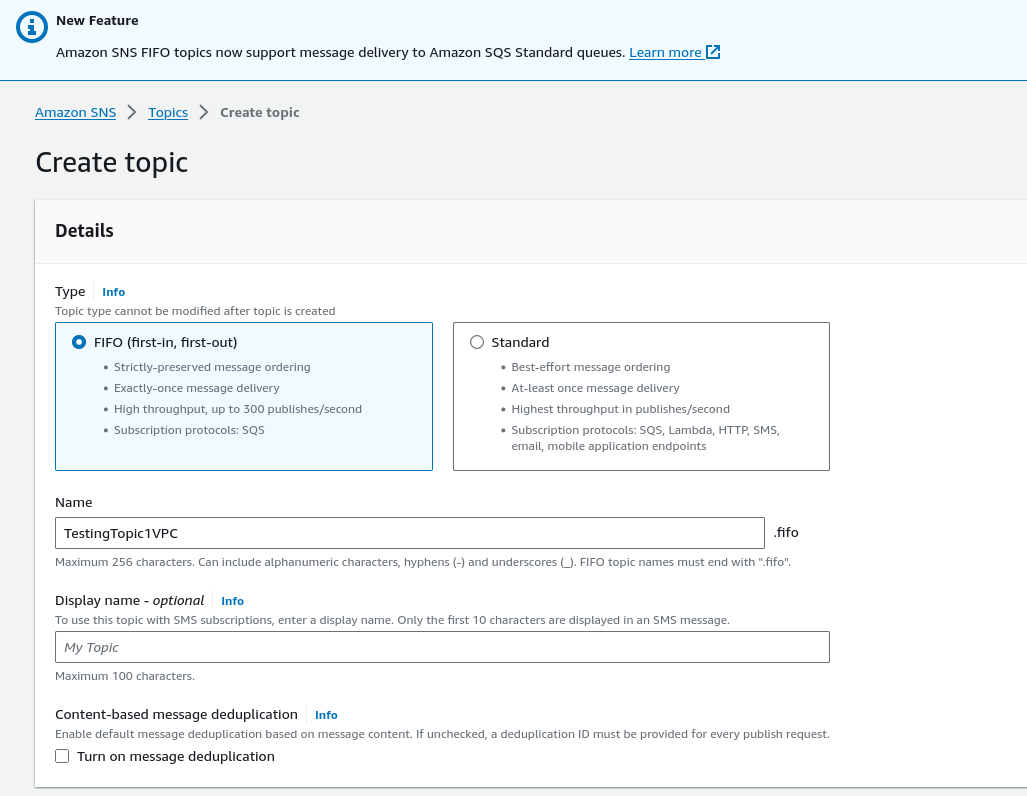
}- Next, we will create SNS Topic by using Amazon SNS Console. Nagivate to Topic and create a new topic. We will be using the topic name “TestingTopic1VPC“.
- In the Access policy section, select Advanced, and update your policy to match the below example. Make sure to update the name of the S3 Bucket, source account and topic name accordingly.
{
  "Version": "2008-10-17",
  "Id": "__default_policy_ID",
  "Statement": [
    {
      "Sid": "__default_statement_ID",
      "Effect": "Allow",
      "Principal": {
        "AWS": "*"
      },
      "Action": [
        "SNS:Publish",
        "SNS:RemovePermission",
        "SNS:SetTopicAttributes",
        "SNS:DeleteTopic",
        "SNS:ListSubscriptionsByTopic",
        "SNS:GetTopicAttributes",
        "SNS:AddPermission",
        "SNS:Subscribe"
      ],
      "Resource": "arn:aws:sns:us-east-1:0123456789:TestingTopic1VPC.fifo",
      "Condition": {
        "StringEquals": {
          "AWS:SourceAccount": "0123456789"
        },
        "ArnLike": {
          "aws:SourceArn": "arn:aws:s3:*:*:vpc-flow-log-bucket3"
        }
      }
    }
  ]
}- We now need to configure the Event Notification for our S3 Bucket.
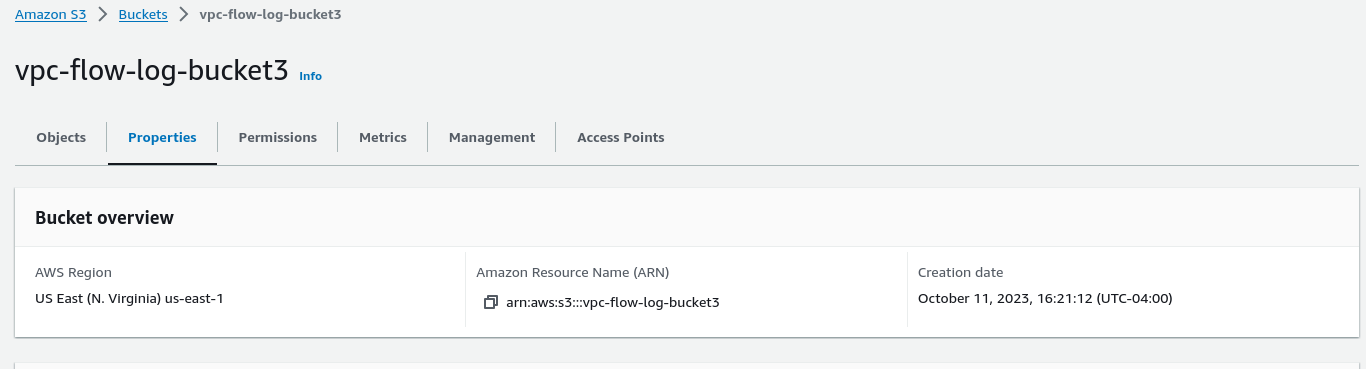
- Navigate to the Amazon S3 console, select your bucket “vpc-flow-log-bucket3” and choose Properties.
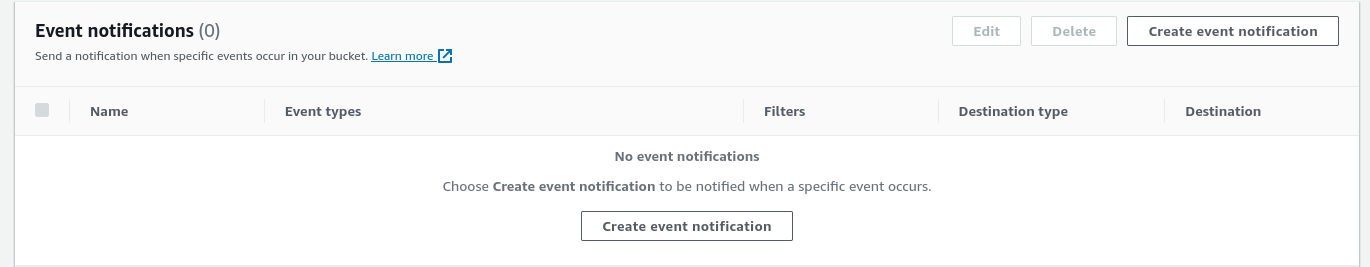
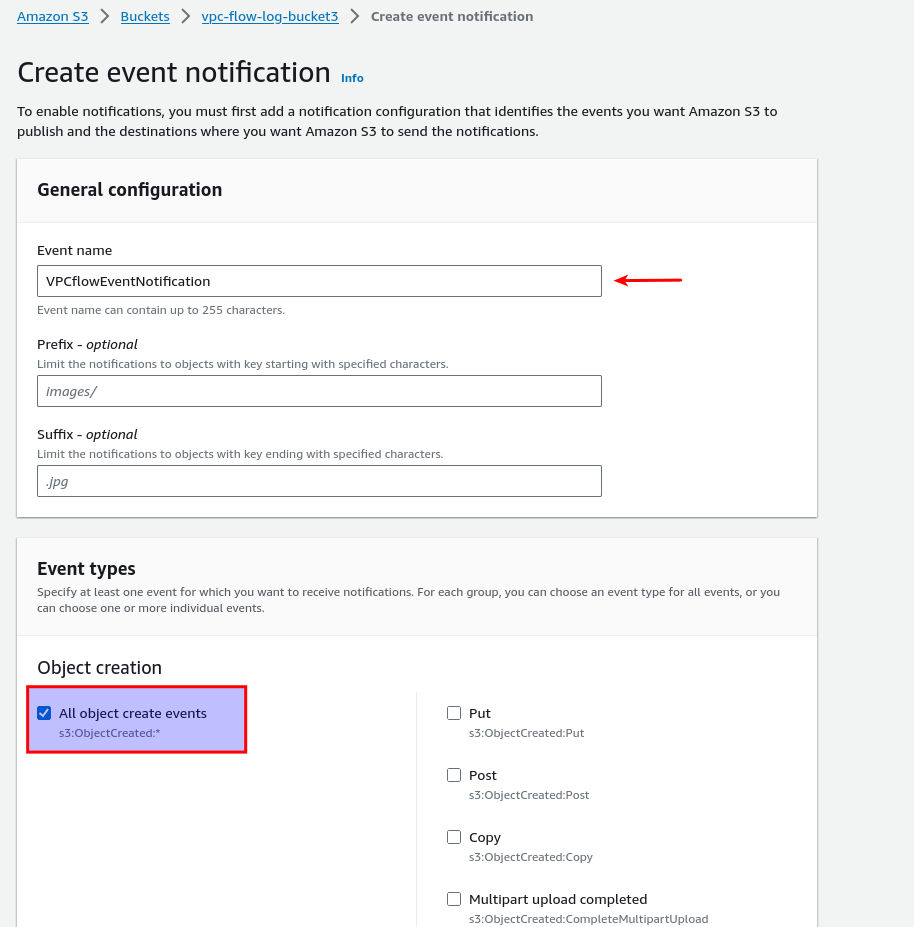
- Navigate to the Event Notifications section and choose Create event notification.
- Fill out the Event name and select “All object create events” in the Object creation sub section.
- In the Destination section, we want to select our SQS queue we created previously by choosing it from the drop down menu.
- Save changes.
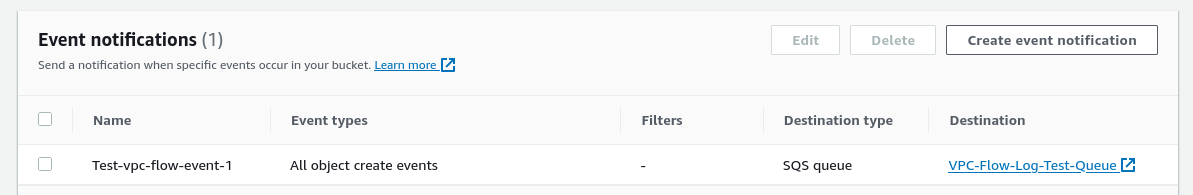
- The Event notifications of the bucket should like below
- Navigate to the Amazon S3 console, select your bucket “vpc-flow-log-bucket3” and choose Properties.

Step 3: Ingesting VPC Flow Logs with Filebeat
With SQS set up as the intermediary, it’s time to ingest VPC Flow Logs into Elasticsearch using Filebeat along with the provided aws module.
We will be installing filebeat on a same Linux machine where Elasticsearch is running. Filebeat simplifies log data shipping to Elasticsearch. More information on the installation can be found here.
curl -L -O https://artifacts.elastic.co/downloads/beats/filebeat/filebeat-8.10.4-amd64.deb
sudo dpkg -i filebeat-8.10.4-amd64.deb
Let’s edit the configuration file “/etc/filebeat/filebeat.yml”
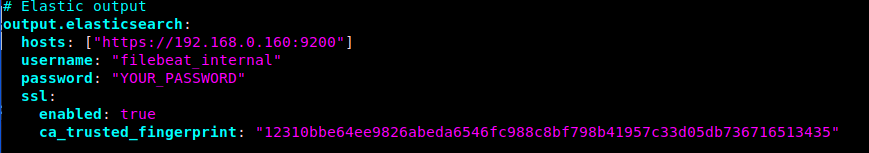
- Specify the target host and port where Filebeat can find the Elasticsearch installation.
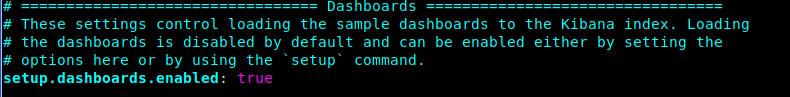
Note: This example shows a hard-coded password and fingerprint, but you should store sensitive values in the secrets keystore. - Enable the pre-built Kibana dashboards by making the changes to the section below
Next, we will need to enable the data collection module and configure it.
- Enable the Filebeat AWS module by running the command below
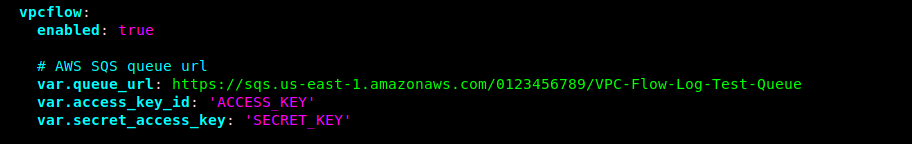
filebeat modules enable aws- AWS module configuration is located in the file “/etc/filebeat/modules.d/aws.yml”. We can use our favorite file editor to edit the vpcflow section like shown below:
Note: This example shows a hard-coded access_key_id and secret_access_key, but you should store sensitive values in the secrets keystore. - We can now start filebeat
sudo service filebeat startStep 4: Analyzing VPC Flow Logs
With VPC Flow Logs ingested into Elasticsearch, you can now leverage Elasticsearch’s querying capabilities to perform in-depth analyses:
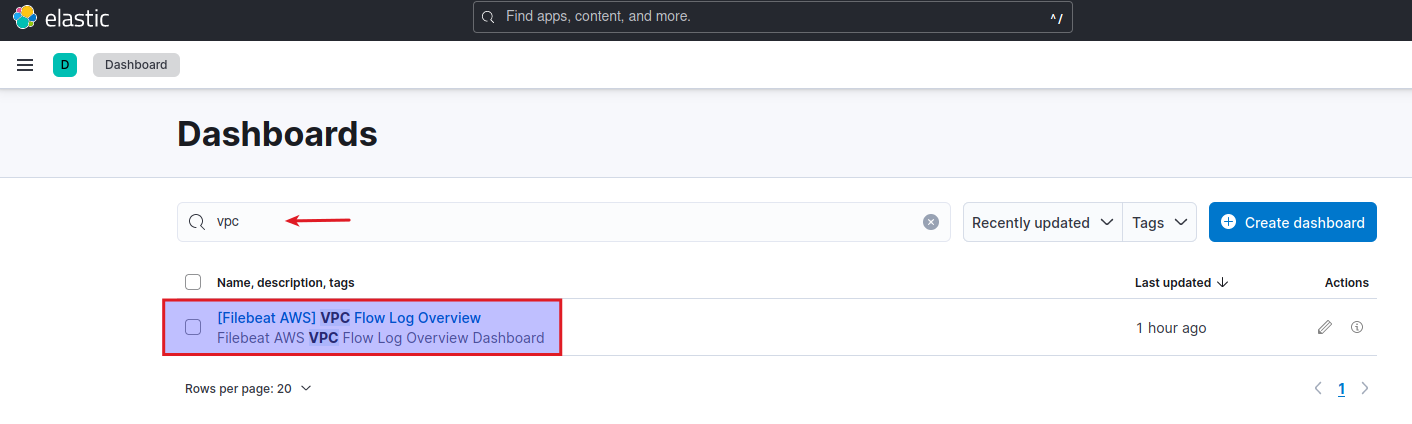
- Let’s go to Elasticsearch dashboard and and search for “VPC” and select “[Filebeat AWS] VPC Flow Log Overview“
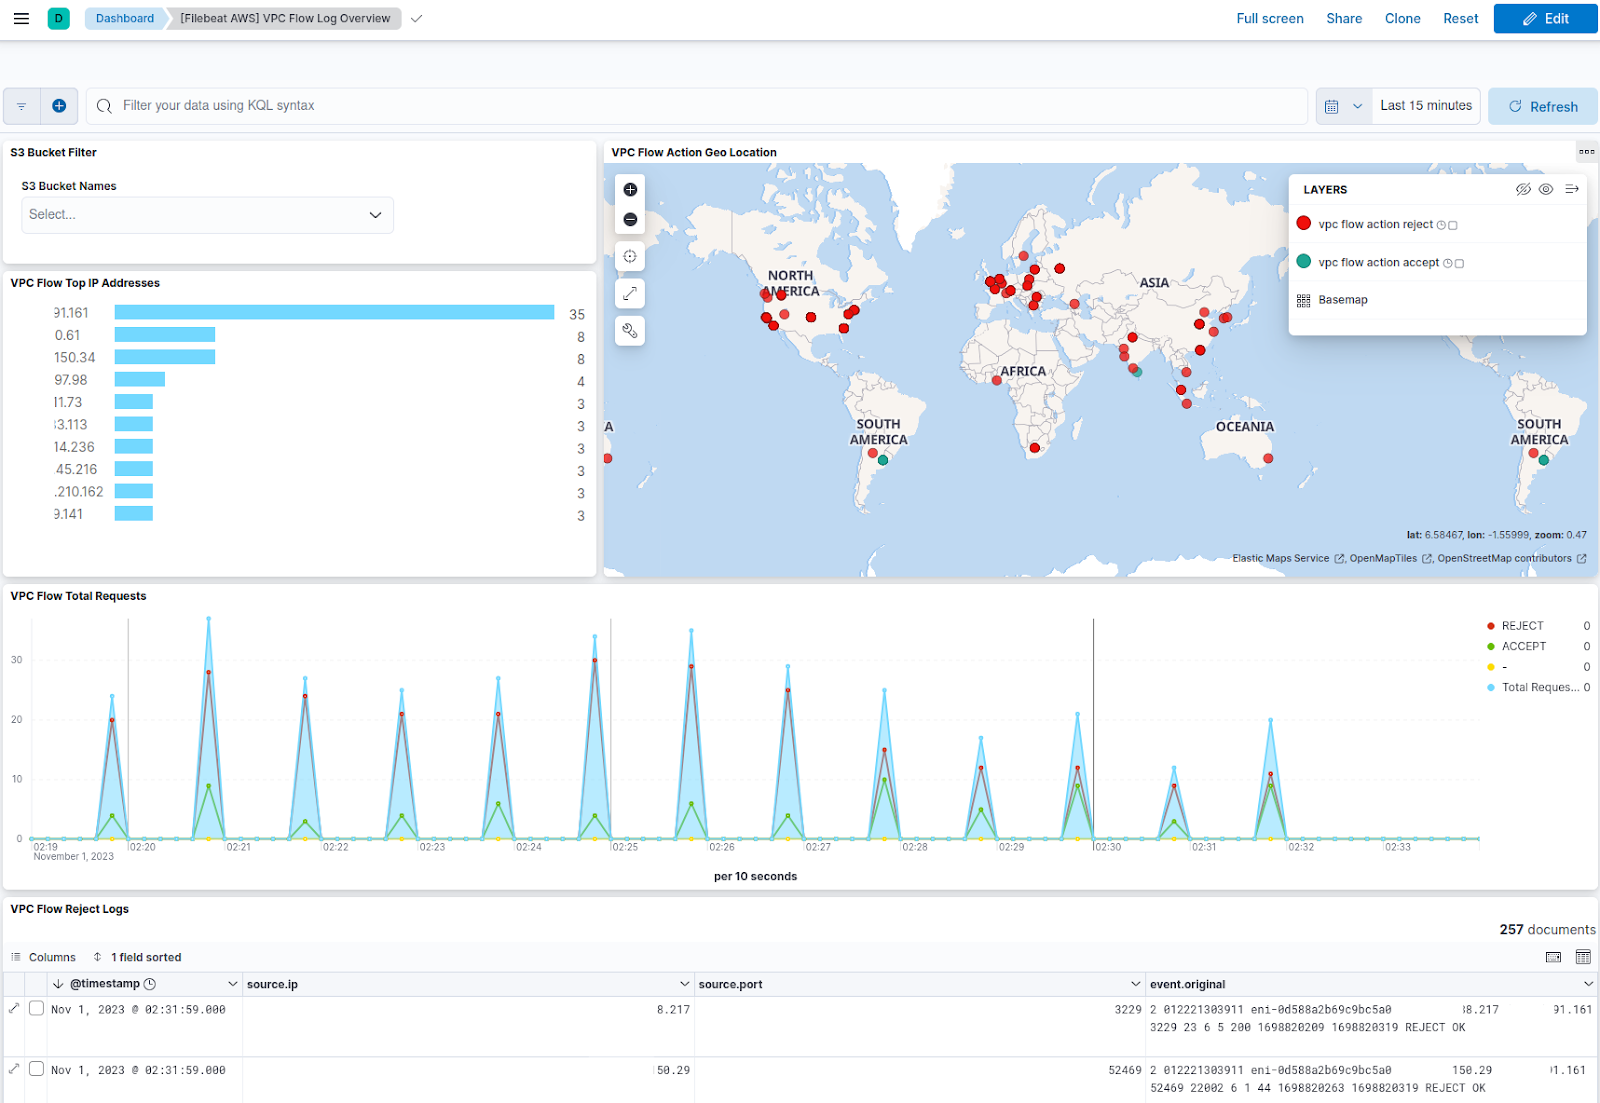
We should now be taken to the “VPC FLOW Log Overview” dashboard that gives you a quick glance of the ingested logs. - Additional visualizations and dashboards can be created in Kibana using dynamic charts, graphs to better understand your data.
- Craft Elasticsearch queries: Use Elasticsearch queries to filter, aggregate, and analyze the VPC Flow Logs data based on your specific use cases.
- Set up real-time alerts: Configure alerting in Kibana to notify you of specific network anomalies or security events as they occur.
Conclusion
Ingesting AWS VPC Flow Logs into Elasticsearch using AWS SQS and Filebeat is a scalable, real-time solution that offers flexibility and robust data analysis capabilities. It allows you to efficiently monitor and optimize your VPC’s network performance and security.
Always stay updated with AWS and Elasticsearch configurations and consider the security implications of handling sensitive log data. If you have further questions or need assistance with specific aspects of this setup, please don’t hesitate to reach out and ask!